
Trusted By Leading Organizations


Why Choose Our Distributor Analytics Software?
How Our Distributor Analytics Software Works
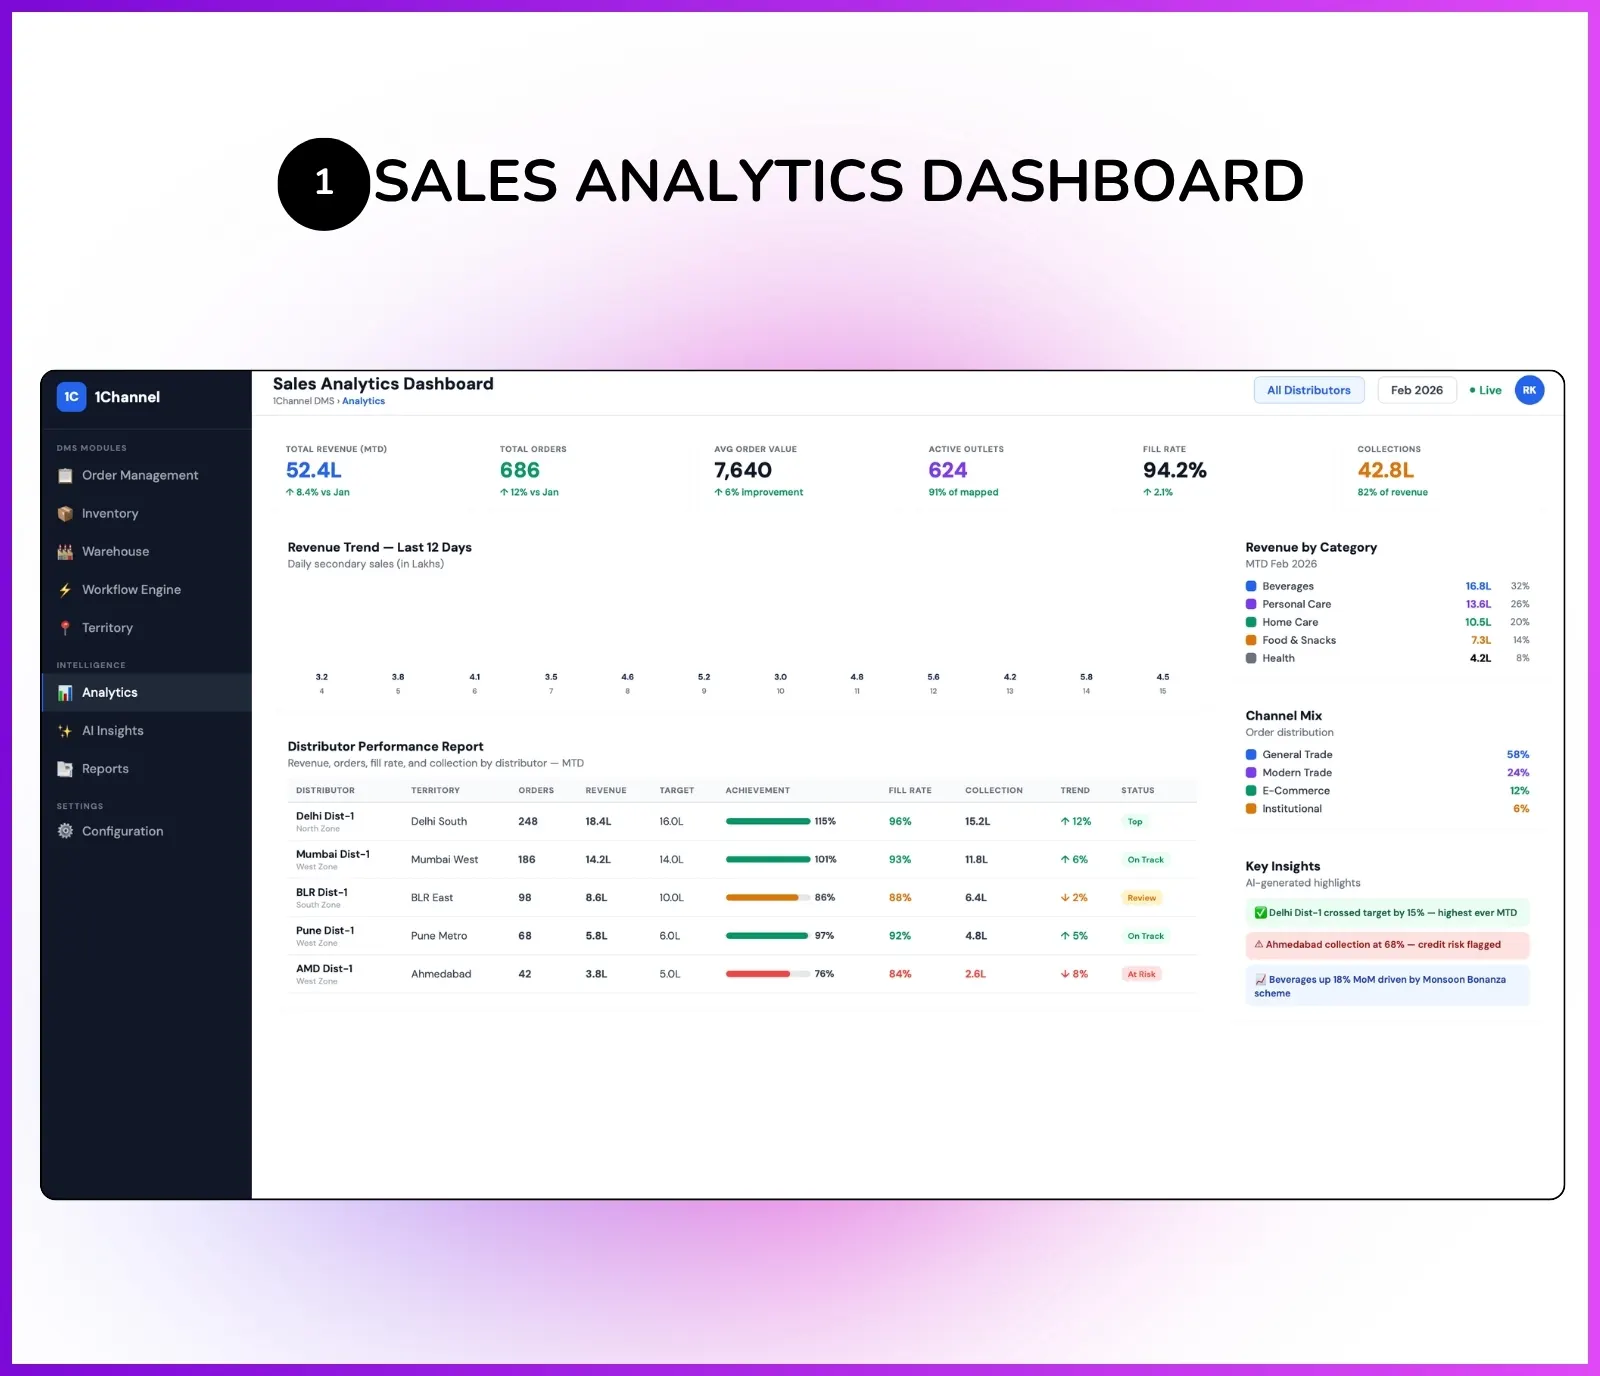
The dashboard shows KPIs, charts, top products, and all related analytics. Everything can be exported. Reports open in a side panel where users can explore data without leaving the current screen, apply filters, and export directly.
- Real-Time Dashboard & KPIs
- 24+ Default Reports & Filters
- CSV Export & 7-Day CacheSide Panel Report Exploration
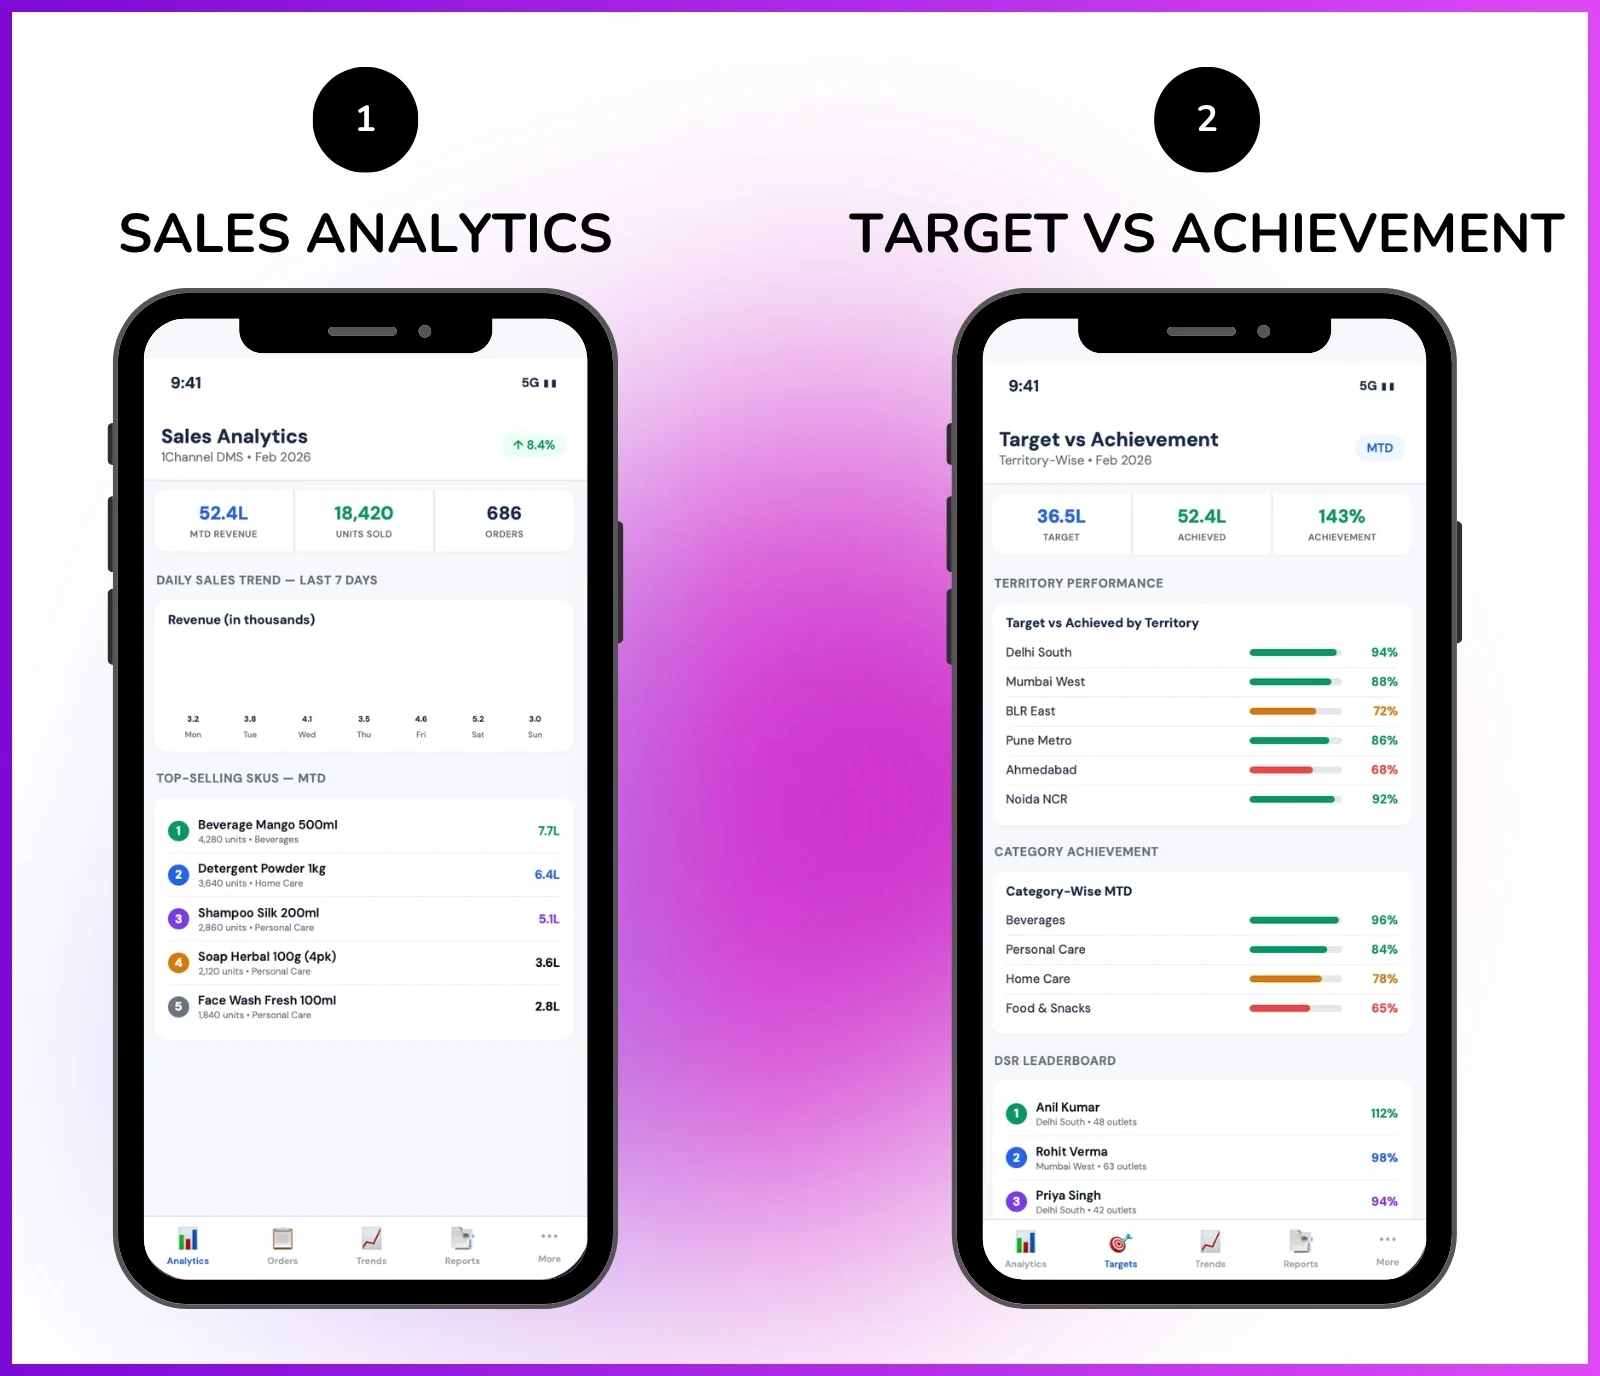
- Sales Trends & Order AnalyticsMobile Analytics Dashboard
Comprehensive Analytics & Reporting Features
The Admin Portal provides centralized analytics covering orders, revenue, inventory, outstanding payments, scheme utilization, and distributor performance. Users can customize dashboard themes, set dark or light mode, and configure regional settings including time zone, date format, and financial year.
Sales Trend Dashboard
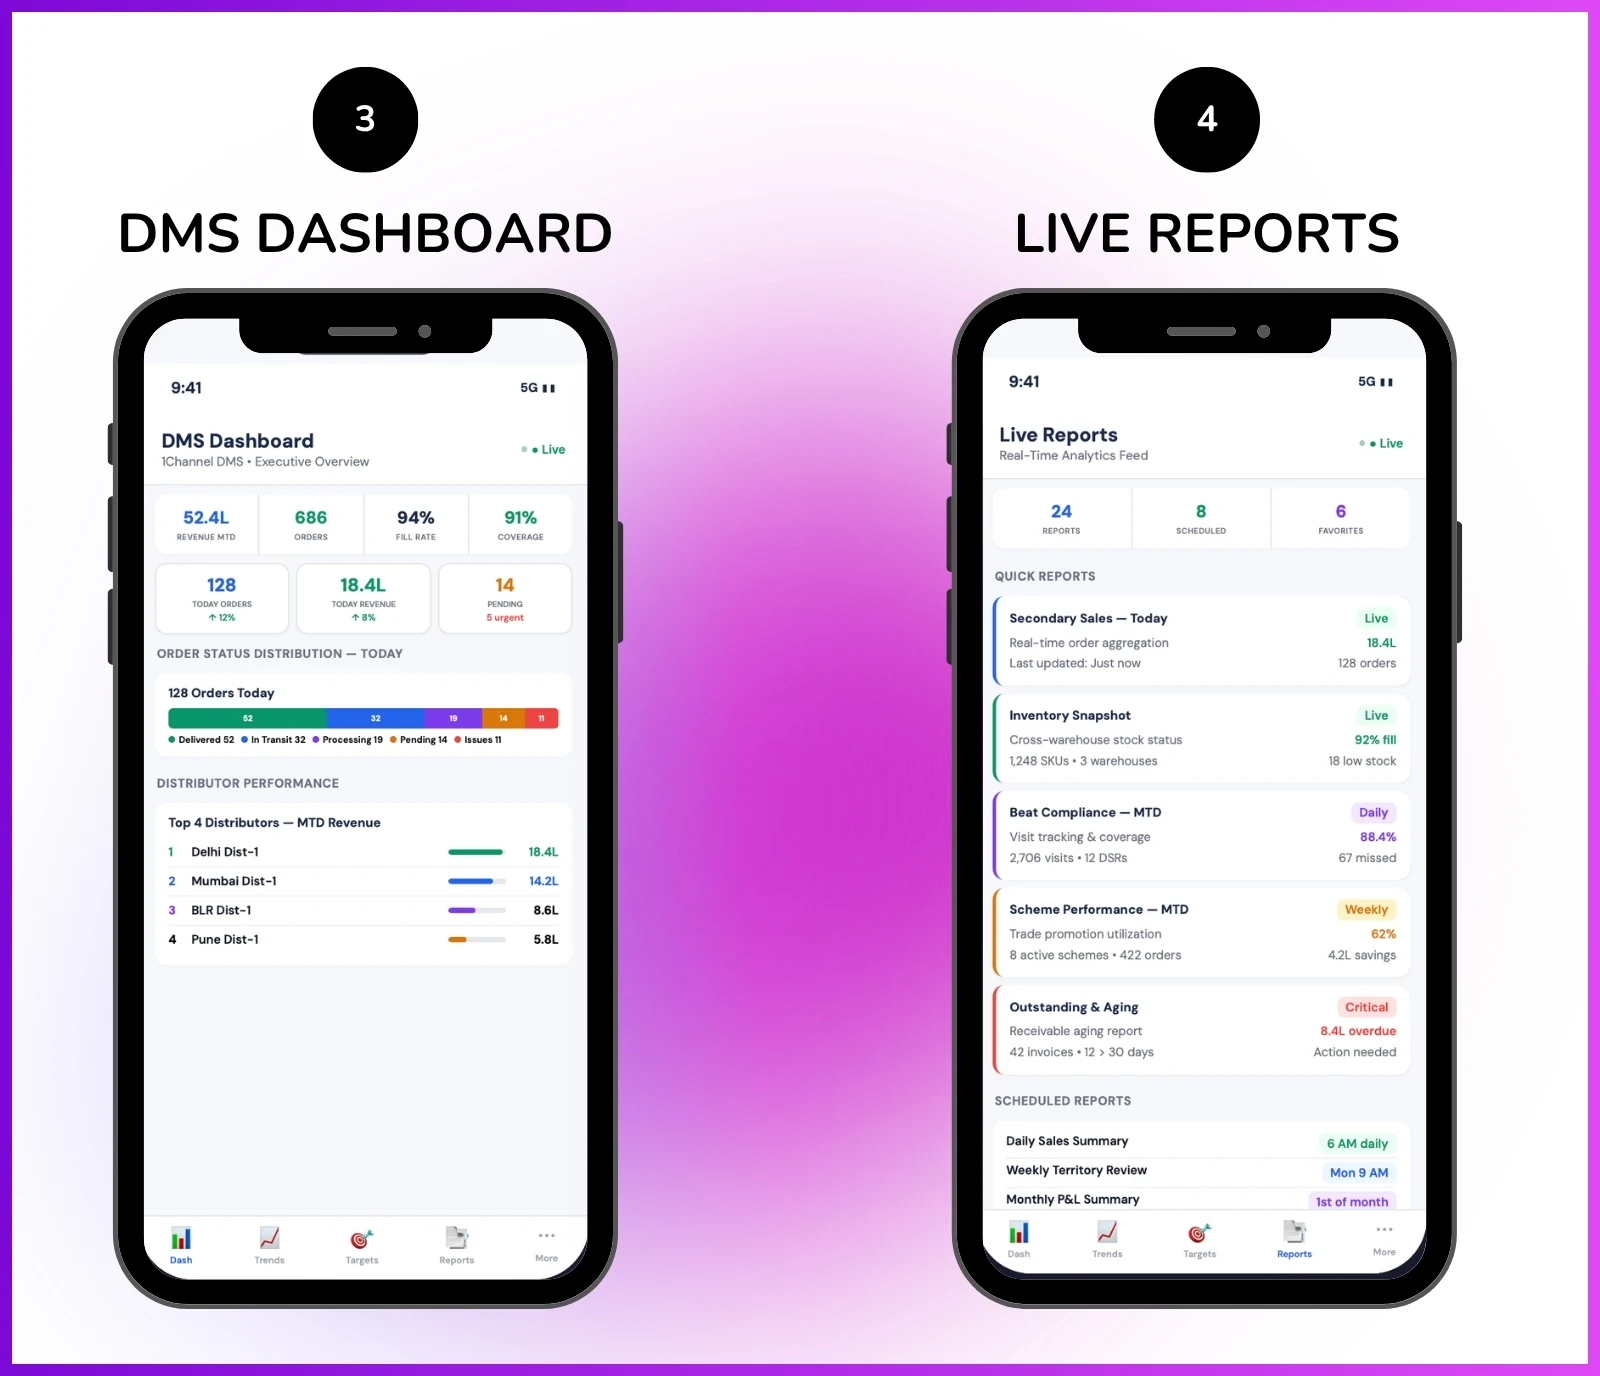
On the dashboard, users can see today's orders, revenue, total order count, active users in the system, and can directly redirect to the inventory screen. There is also a sales overview section showing sales trends, total orders, and order status distribution like delivered, processing, etc. Recent activity is also displayed there.
Dashboard KPIs
- Today's Orders & Revenue
- Total Order Count
- Active Users in the System
- Sales Overview & Sales Trends
- Order Status Distribution (Delivered, Processing, etc.)
- Recent Activity Log
- Inventory Screen Redirect
- Top Products & Top-Selling SKUs
- Weekly & Monthly Sales Trends
- Coverage & Productivity Data
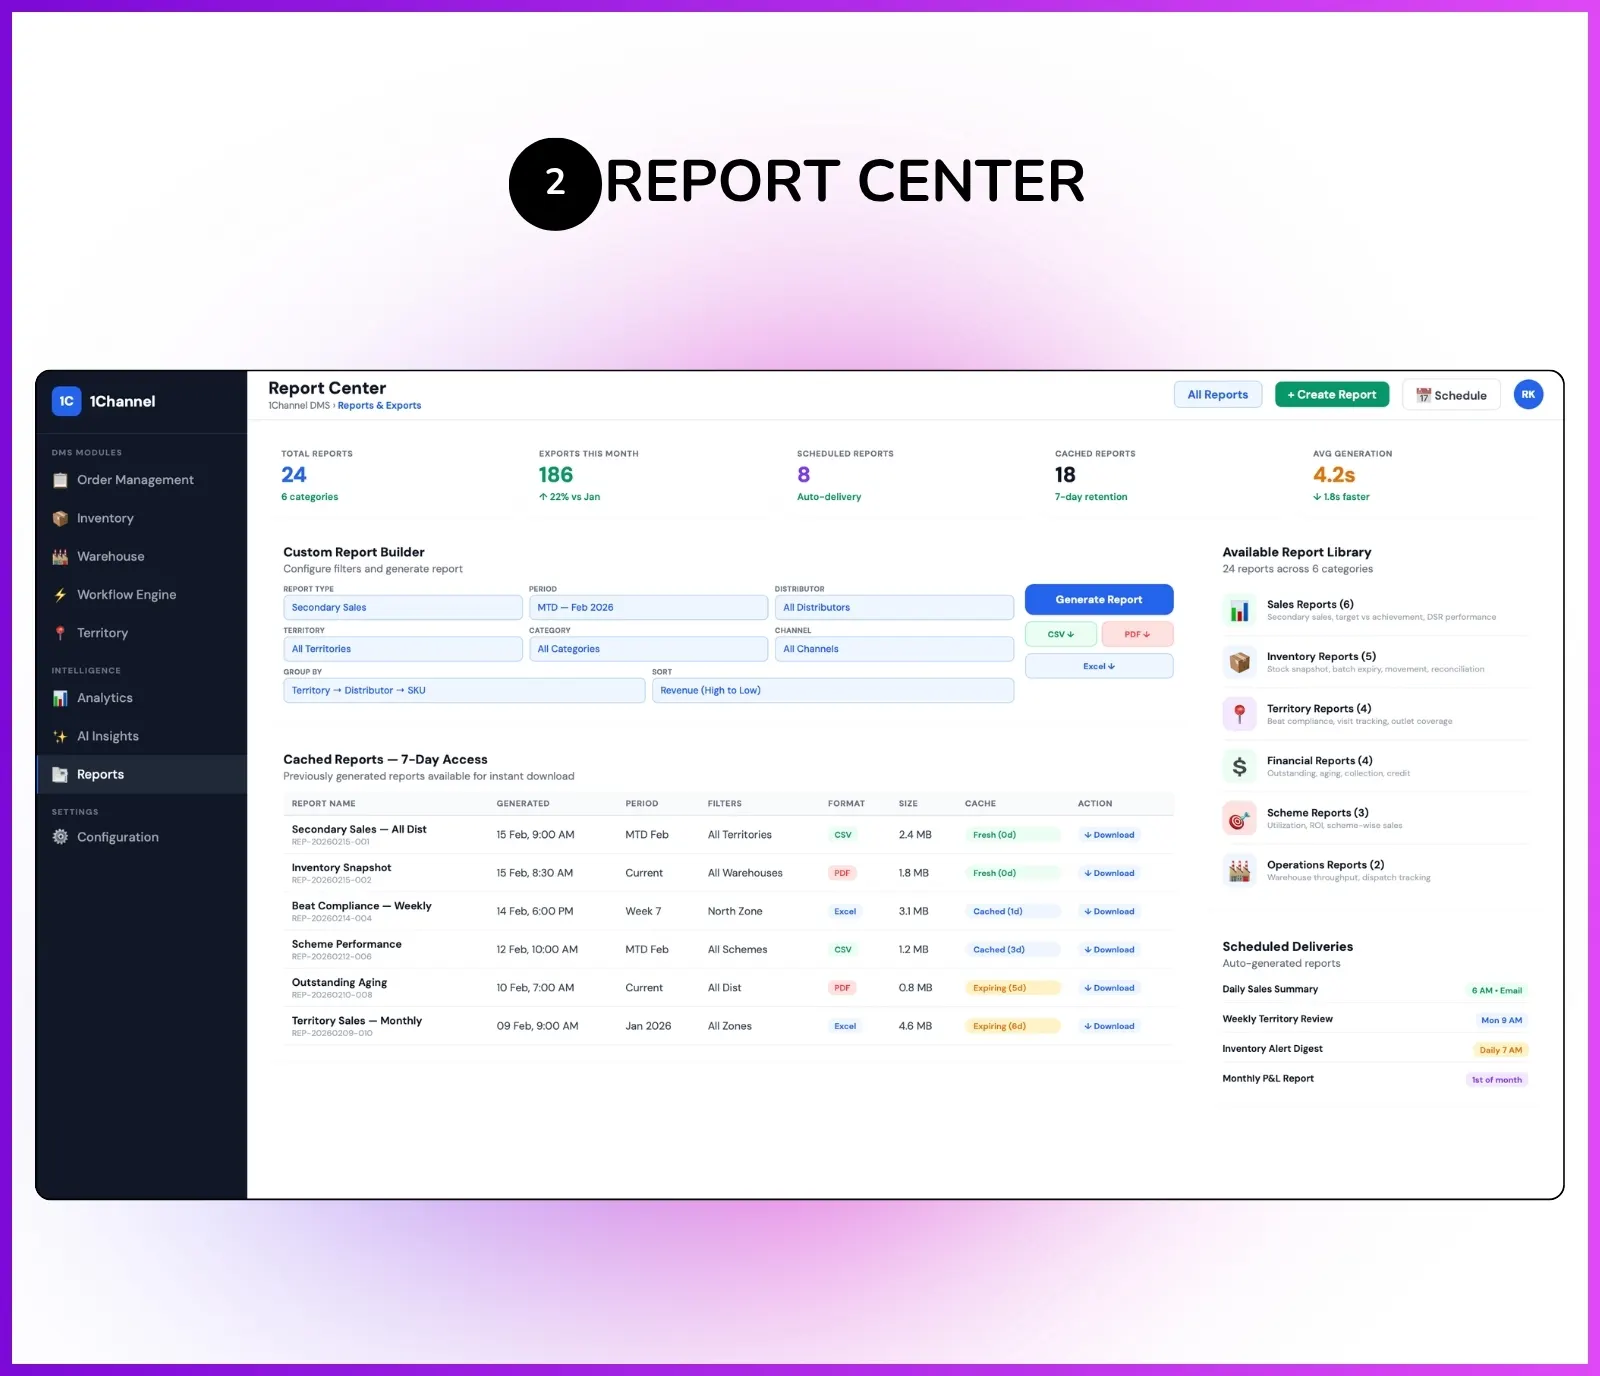
24+ Default Reports & Custom Filters
We already have around 24 default reports in the system. Reports can be simplified, filtered, and exported into CSV format. Reports open in a side panel where users can explore the data without leaving the current screen. Users can click on any report, apply filters like warehouse, brand, status, or any custom filter requirement, and export it directly.
- 24+ Pre-Built Default Reports
- Configurable Filters (Warehouse, Brand, Status, Custom)
- CSV Format Export
- Side Panel Report Exploration
- Filter & Export Without Leaving Current Screen
- Order Summary Reports
- Customer Outstanding Reports
- Product Performance Reports
Export Caching & Team Sharing
Once a report is exported, it is available in a dedicated Exports section for the next 7 days, so users do not need to regenerate the same report repeatedly. This helps reduce load on the system because reports are generated in real time. For example, if Ayushi has already downloaded a report and Sayantan needs the same report, he can directly access the exported version instead of generating it again.
- 7-Day Export Cache for Re-Access Without Regeneration
- Shared Export Access Across Team Members
- Reduces System Load from Real-Time Generation
- Dedicated Exports Section for All Generated Reports
- Real-Time Report Generation on Demand
- Date-Wise & Territory-Wise Filtering
- Financial Year Configuration for Report Alignment
- Time Zone & Date Format Settings
Key Features & Benefits of Distributor Analytics
Sales Trend Dashboard
24+ Default Reports
Real-Time Reporting
7-Day Export Cache
Side Panel Exploration
Custom Report Builder
Order & Inventory Analytics
Payment & Credit Reports
Target Achievement
Mobile Analytics
CSV Export
Fully Configurable
Who Uses Distributor Analytics & Reporting Software?
Built for businesses needing real-time visibility into sales trends, distributor performance, inventory levels, outstanding payments, and operational KPIs across distribution networks in India and globally.
- FMCG & CPG Companies – Track sales trends, order status distribution, and secondary sales across India's multi-tier distribution network. 24+ reports with territory-wise filtering and CSV export with 7-day cache
- Beverage & Alcohol Brands – Monitor distributor performance, batch-wise inventory, and scheme utilization across on-trade and off-trade channels. Real-time dashboards with configurable filters
- Consumer Durables – Analyze dealer order patterns, credit limit utilization, and outstanding balances across modern and general trade. Side panel report exploration without leaving current screen
- Personal Care & Cosmetics – Track top-selling SKUs, weekly/monthly sales trends, and target vs achievement from the mobile app. Field teams access analytics during market visits across India
- Pharmaceuticals – Monitor stockist inventory levels, batch expiry tracking, and GRN discrepancy reports across pharmacy chains. Financial year-aligned reporting with GST configuration
- Food & Snacks Brands – Track order lifecycle from placement to dispatch to invoice. Monitor outstanding payments (e.g., ₹2,79,765 over limit) and credit limit compliance across territories
- Building Materials & Cement – Analyze territory-wise sales, geography-based pricing impact (₹100 North India vs ₹150 South India), and distributor coverage analytics across India
- Electronics & Appliances – Track warehouse inventory value, stock movement history, and product performance reports. Role-based report access for distributors, super stockists, and admins
PRICING
Yearly Plan
Other 1Channel Solutions for Sales Teams
Sales Force Automation Software
Complete field sales management with order booking, distributor management, and beat planning.
CRM Software
Manage customer relationships, track interactions, and automate sales pipelines.
Loyalty Management Software
Channel partner and influencer loyalty programs with rewards and points redemption.
Retail Execution Software
Merchandising, shelf audits, planogram compliance, and retail visibility tracking.
LMS for Sales Teams
Training, onboarding, certification, and knowledge assessments for field teams.
Distributor Order Management
Centralized order booking, approval workflows, delivery notes, and secondary sales operations.
Payment & Credit Management
Outstanding tracking, credit limits, invoice payment allocation, and credit note processing.
Inventory & Stock Management
Track sellable stock, warehouse inventory, transit stock, and stock movements with automated replenishment.
Trade Promotion Management
Value-based, volume-based, and free goods schemes with auto-application during order placement.
Territory & Beat Management
Configurable geography hierarchy, beat planning, outlet mapping, and field user assignment.
Customers Speak
With 1Channel, we've achieved 100% digitisation in sales team movement, order management, and inventory visibility, transforming the way we operate. The most beautiful thing about 1Channel is its ability to be completely customised to meet our organisation's unique requirements.

1Channel is one of the best CRM software for field teams. It helps us collect data from over 100 field salespeople across the Gulf region and send instant analytical reports. When we walk into the office in the morning, the automatic sales reports are already waiting in our mailbox.

Thanks to 1Channel SFA tool, we have managed to automate our manual sales process across Asia and Australia into a mobility-based solution, with details of every account over the cloud. Key account managers can see results, any time, across the region.

1Channel SFA tool has made a huge impact on our sales reports, making it easy to track number of customer visits with realistic numbers. The support has been excellent. I am glad to be working with the right partner who understands our requirements.

Before 1Channel CRM software, we evaluated many sales CRM apps and choose them over the others for the innumerable configuration options that meet our business requirements. It is now very easy for us to manage field sales operations in a simple click.

Rewards and Recognition
Our recognitions constantly motivate us to push the envelope of excellence and empower our customers with winning ideas each day.
Celebrating Growth Milestones on Play Store, App Store, & G2


