Sales Analytics Software for Real-Time Field Sales Decisions
Stop waiting on Excel reports and email chains: 40+ pre-built reports, a custom report builder, real-time dashboards, MTD sales tracking, and automated scheduling, all from one system.
✨ See what AI actually does →40+ ready-to-use reports across sales, productivity, visits, and attendance, each with filters and an Excel download.
| Report | Category | Filters | Action |
|---|---|---|---|
| MTD Tertiary Sales | Sales | Date, SKU, Territory | Generate |
| Sales Productivity (Unit) | Productivity | Store, Date Range | Generate |
| Beat Compliance Report | Compliance | Employee, Territory | Generate |
Month-to-date Tertiary Sales, Secondary Sales, and Sales by Product Category with SKU-level detail and date-range filters.
| Date | SKU | Tertiary Sales (₹) | Secondary Sales (₹) |
|---|---|---|---|
| 24 Sep | SKU-2201 | ₹2,18,400 | ₹1,96,200 |
| 24 Sep | SKU-2214 | ₹1,42,900 | ₹1,30,500 |
| 23 Sep | SKU-2247 | ₹88,750 | ₹81,300 |
SKU-wise sales by unit and value per store, with average daily productivity and visit-level activity breakdown.
| Store | Units Sold | Value Sold (₹) | Avg. Daily Productivity |
|---|---|---|---|
| Sri Ganesh Stores | 420 | ₹52,600 | High |
| City Mart | 180 | ₹24,100 | Average |
| New Krishna Traders | 95 | ₹11,400 | Low |
Default landing screen on login: attendance %, market visit %, and compliance details, with calendar-based tracking.
Build a report from scratch: pick a dimension, define filters, save it, and reuse it anytime.
- Each Unit Sale
- Summary Sale
- Demo
- Secondary Sale
- Stock
- Attendance
- Merchandising
| Report Title | Dimension | Location Filter |
|---|---|---|
| Territory-wise Unit Sales | Each Unit Sale | Delhi, Noida |
| SKU Stock Report | Stock | Mumbai |
Daily store visits, market visit plans, distance travelled, and first/last transaction time per employee.
| Employee | Stores Visited | Distance (km) | First Txn |
|---|---|---|---|
| R. Kapoor | 14 | 38.2 | 09:42 AM |
| S. Iyer | 11 | 29.6 | 10:05 AM |
Attendance Summary, Attendance Photo Report, and Beat Compliance, with photo and GPS location verification.
| Employee | Status | Beat Compliance | Location |
|---|---|---|---|
| R. Kapoor | Present | 93% | Verified |
| M. Reddy | Late | 78% | Verified |
Schedule any report to auto-generate and email to stakeholders daily, weekly, or monthly, no manual intervention needed.
| Report | Frequency | Recipients | Status |
|---|---|---|---|
| MTD Secondary Sales | Daily · 9 AM | 3 Managers | Active |
| Beat Compliance Summary | Weekly · Mon | Regional Head | Active |








Field Data, Mapped as One Continuous Flow
From a field transaction to a stakeholder's inbox, every report stays connected and up to date.
Field Data Capture
Sales, visits, attendanceReport Catalog
40+ pre-built reportsCustom Report Builder
7 data dimensionsReal-Time Dashboard
Attendance & complianceAutomated Scheduling
Daily, weekly, monthlyReal Apps, Real Reviews
Available on Google Play and the App Store: live listings, not screenshots.

1Channel



1Channel CRM

1View

1Channel DMS
Built for How Field Sales Actually Reports In
Key features & benefits: drag or use the arrows to see all 12.
Report Catalog (40+ Reports)
Ready-to-use sales reports covering MTD sales, productivity, visit tracking, attendance, and compliance, each with filters and an Excel download.
Custom Report Builder
Create reports from scratch across 7 dimensions: Each Unit Sale, Summary Sale, Demo, Secondary Sale, Stock, Attendance, and Merchandising.
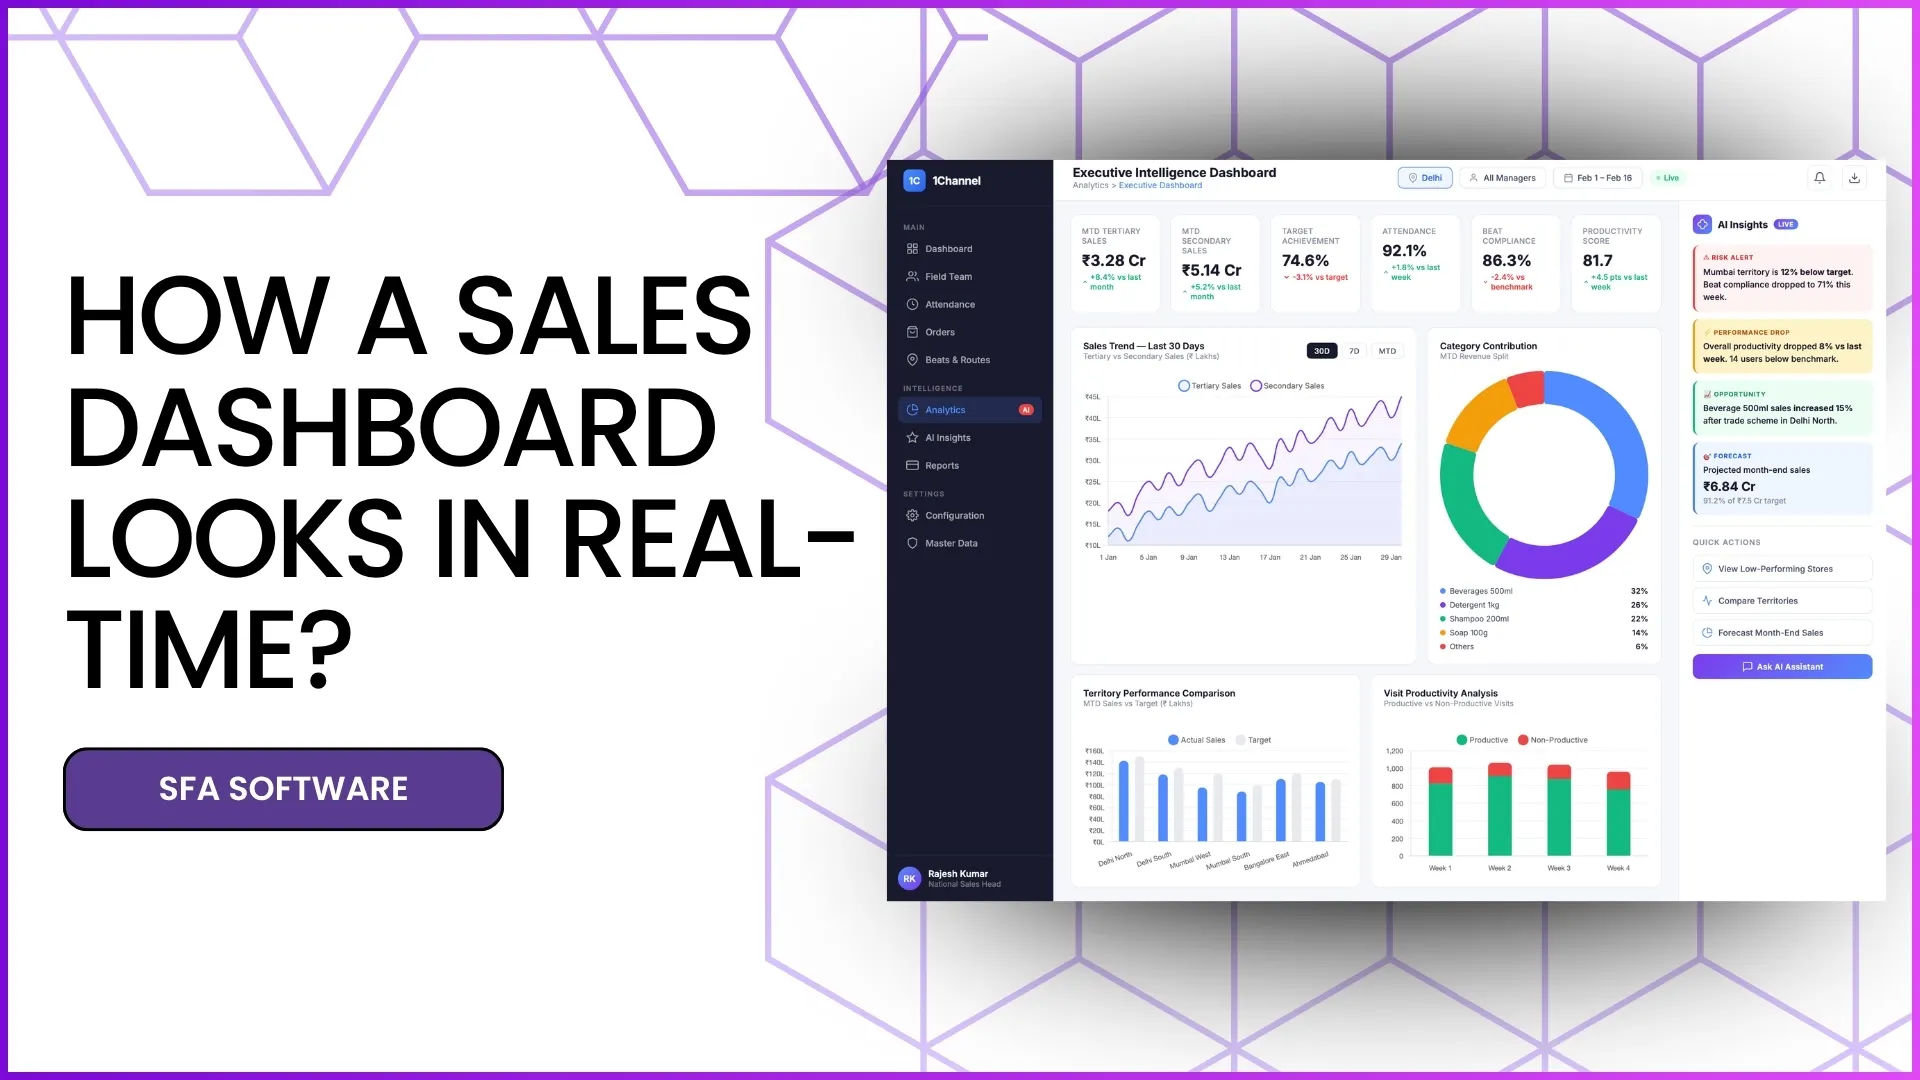
Real-Time Analytics Dashboard
Default landing screen with attendance %, market visit %, and compliance details, role-based for Admin, Manager, and Team Leader.
MTD Sales Tracking
Month-to-date Tertiary Sales, Secondary Sales, and Sales by Product Category with SKU-level detail and date-range filters.
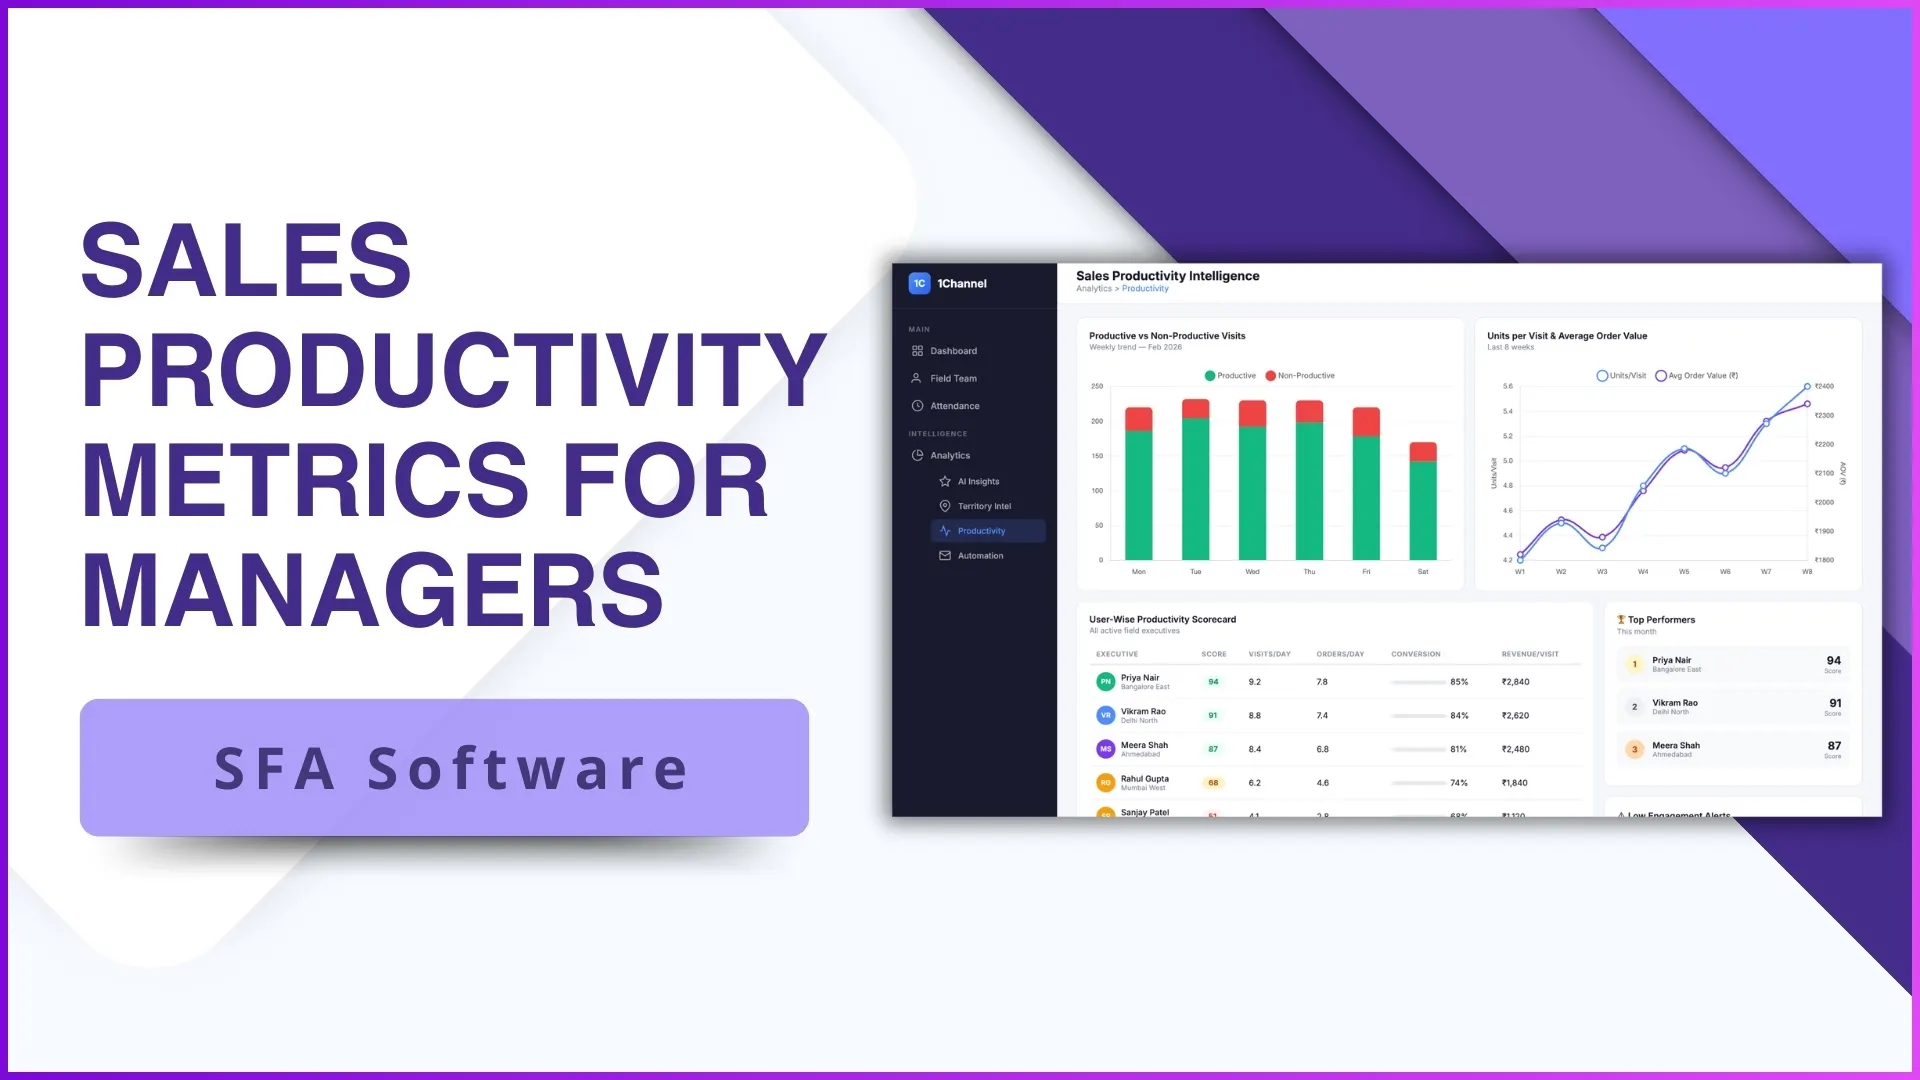
Sales Productivity Reports
SKU-wise sales by unit and value per store, identifying productive vs non-productive visits for field resource allocation.
Automated Report Scheduling
Schedule any report to auto-generate and email to stakeholders daily, weekly, or monthly, with no manual intervention.
Visit & Activity Analytics
Daily store visits, market visit plans, distance travelled, and first/last transaction time, with a photo gallery for audits.
Attendance & Compliance Reports
Attendance Summary, Attendance Photo Report, and GPS-verified employee attendance for payroll integration.
Multi-Dimension Filters & Excel Export
Filter any report by City, Channel, Category, SKU, Date Range, User, and Store, then download in Excel/CSV.
Beat Compliance Tracking
Compliance = Stores Covered ÷ Stores in Beat Plan, flagging route deviations for coaching and territory analysis.
Mobile App Analytics Access
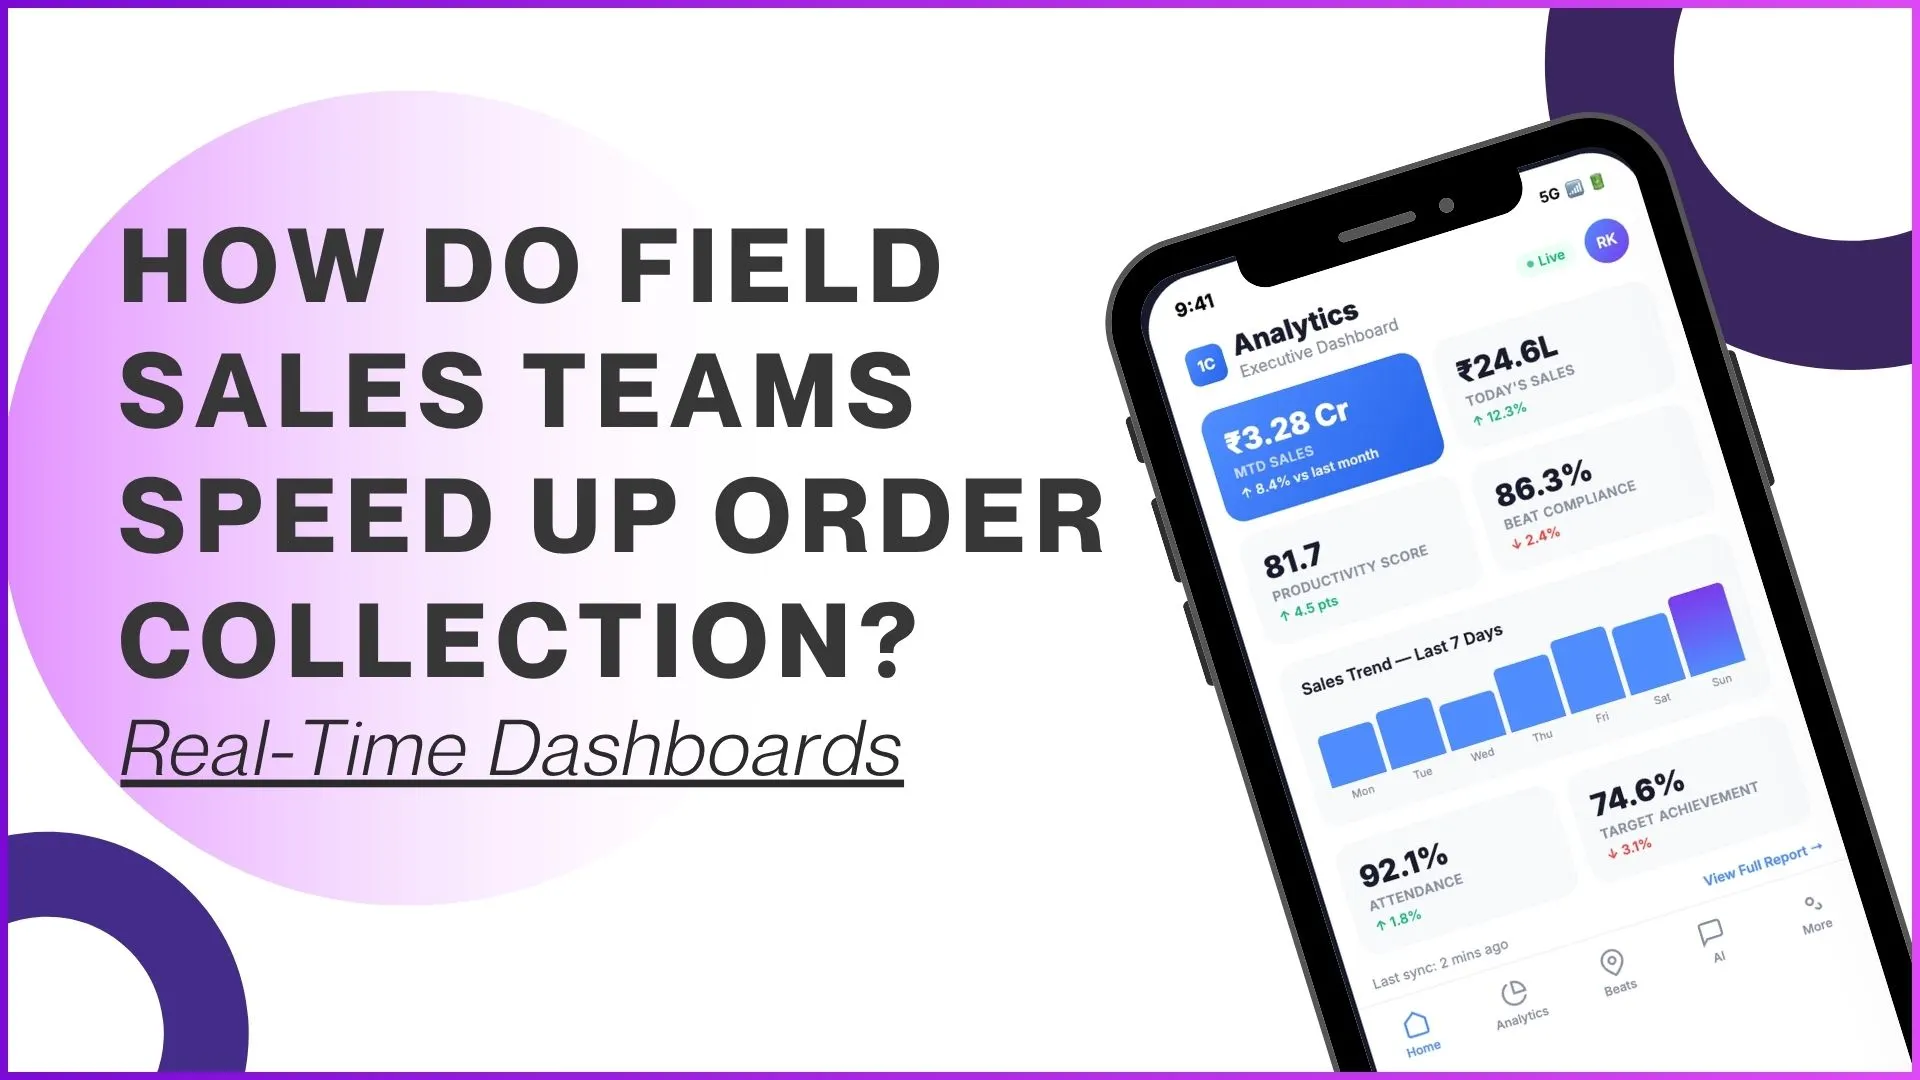
Field teams and managers access key reports on Android and iOS with offline mode and real-time sync.
Enterprise-Grade Scalability
200,000+ users across 40+ countries, with complete onboarding, training, and ongoing support.
AI That Reads Your Sales Analytics For You, Not Where We Wish It Did
We'd rather show exactly what the AI does than oversell it. Here's what's real today, across the 1Channel AI suite:
- 💬AI Assistant, plain-language data lookupsAsk "Show MTD sales for Zone 4" or "How is beat compliance trending?" in plain English, on web and mobile.
- 🏆Catalyst, automatic coaching reportsCatalyst scans productivity and compliance data and flags which reps need coaching this week, before a manager has to go looking.
- ⚙️Rule-based report automationScheduled reports, threshold alerts, and email delivery run on fixed business rules, not a predictive model.
Sales Analytics & Reporting Insights, Straight from the Field

Go Deeper Into Every Module
How field data actually becomes a report, from a transaction on the ground to a stakeholder's inbox. It connects directly to Sales Force Automation, Distributor Management, and Attendance Tracking.
Report Catalog & MTD Sales Tracking
An extensive library of ready-to-use sales reports, such as 40+ examples, covers MTD sales, productivity analytics, visit tracking, and attendance monitoring, all with customizable filters and Excel downloads. MTD Tertiary Sales, MTD Secondary Sales, and MTD Sales by Product Category reports show SKU-level detail and date-based breakdown for the current month.
How It Works
- Admin logs into portal → Analytics → Report Catalog
- Browses the report library organized by category: Sales, Productivity, Visits, Attendance
- Selects a report, applies filters (Date Range, City, Channel, Category, SKU, User, Store)
- Generates the report in-portal, then downloads it in Excel format
Why It Matters
- No manual Excel compilation, reports pull live from field data
- SKU-level MTD visibility across Tertiary and Secondary sales
- Filterable by salesperson, territory, category for targeted analysis
| SKU | Tertiary Sales (₹) | Secondary Sales (₹) |
|---|---|---|
| SKU-2201 | ₹2,18,400 | ₹1,96,200 |
| SKU-2214 | ₹1,42,900 | ₹1,30,500 |
Click a row: every field here is a real column from the actual MTD Sales report.
Custom Report Builder & Multi-Dimension Analysis
When the report catalog doesn't have the exact cut a manager needs, Report Builder creates custom reports from scratch using data dimensions: Each Unit Sale, Summary Sale, Demo, Secondary Sale, Stock, Attendance, and Merchandising. Reports are saved in the "Reports" section for regeneration anytime, with updated data.
How to Build
- Admin logs into portal → Analytics → Report Builder → "Create New Report"
- Defines a title, selects a dimension, and the matching type auto-populates
- Selects location filters (Delhi, Noida, Mumbai, etc.) and defines a tab/prompt filter
- Saves the report for future use, then downloads it in Excel format
Why It Matters
- Mix and match dimensions to build complex multi-dimensional reports
- No IT support needed, business users build their own analytics
- Filter any report by City, Channel, Category, SKU, Date Range, User, Store
| Report Title | Dimension | Location |
|---|---|---|
| Territory-wise Unit Sales | Each Unit Sale | Delhi, Noida |
| SKU Stock Report | Stock | Mumbai |
Click a row: these are the real Report Builder fields, not placeholders.
Real-Time Dashboard, Visit & Attendance Analytics
The Advanced Dashboard is the default first screen after login, showing attendance reporting %, present %, late attendance %, market visit %, and a "not marked defaulter" % for compliance monitoring. Visit Productivity, Market Visit Plan, and Store Visit reports track field coverage, while Beat Compliance calculates stores covered against the planned route.
Dashboard & Visits
- Calendar vs. Attendance Present Days table shows daily compliance status
- Role-based views for Admin, Manager, and Team Leader
- Market Visit Gallery provides photo evidence with GPS timestamps for audits
Attendance & Compliance
- Beat Compliance = Stores Covered in Day ÷ Stores in Beat Plan for that day
- Attendance Photo Report pairs employee photo with GPS location
- All dashboard elements and reports customizable per client requirements
| Metric | Value |
|---|---|
| Attendance Reporting % | 91% |
| Market Visit % | 86% |
Click a row: the same metrics shown here feed the live dashboard tiles.
Loved by Customers, Recognized by the Industry
"With 1Channel, we've achieved 100% digitisation in sales team movement, order management, and inventory visibility, transforming the way we operate. The most beautiful thing about 1Channel is its ability to be completely customised to meet our organisation's unique requirements."

"1Channel is one of the best CRM software for field teams. It helps us collect data from over 100 field salespeople across the Gulf region and send instant analytical reports. When we walk into the office in the morning, the automatic sales reports are already waiting in our mailbox."

"Thanks to 1Channel SFA tool, we have managed to automate our manual sales process across Asia and Australia into a mobility-based solution, with details of every account over the cloud. Key account managers can see results, any time, across the region."

"1Channel SFA tool has made a huge impact on our sales reports, making it easy to track number of customer visits with realistic numbers. The support has been excellent. I am glad to be working with the right partner who understands our requirements."

"Before 1Channel CRM software, we evaluated many sales CRM apps and choose them over the others for the innumerable configuration options that meet our business requirements. It is now very easy for us to manage field sales operations in a simple click."

Our recognitions constantly motivate us to push the envelope of excellence and empower our customers with winning ideas each day.










Who Uses Sales Analytics Software?
Real-time MTD sales tracking for 25,000+ distributors, with productivity analytics and visit monitoring.
Territory-wise sales reports, beat compliance tracking, and automated stakeholder reporting.
Multi-store sales analytics across 5,000+ outlets with merchandising compliance reports.
Visit productivity tracking, doctor call reports, and sample distribution analytics.
Secondary sales tracking, distributor performance analytics, and scheme effectiveness reports.
Showroom visit analytics, test drive tracking, and sales conversion reports.
Lead visit tracking, conversion analytics, and agent productivity reports.
Distributor sales analytics, stock reports, and order fulfillment tracking.
Pricing
We understand that every organization has unique analytics and reporting requirements. Our Sales Analytics Software offers flexible pricing based on your selected features, user count, and deployment model. No hidden charges, you only pay for what you need.
Every plan includes secure cloud hosting, mobile apps for Android & iOS, and complete training & support at no additional cost.
Frequently Asked Questions
What Is Sales Analytics Software?▾
Why Is It Essential for Field Sales Teams?▾
Can We Customize the Reports in Report Catalog?▾
How Does the Custom Report Builder Work?▾
Can Reports Be Scheduled Automatically?▾
What Is the Advanced Analytics Dashboard?▾
How Long Is Implementation?▾
Other 1Channel Solutions for Sales Teams
Analytics doesn't work in isolation, here's what it connects to.